© 2026 Hexagon AB and/or its subsidiaries
© 2026 Hexagon AB and/or its subsidiaries
Reliable results
Q-DAS qs-STAT is for the evaluation and continuous improvement of industrial production processes and is also available as a web-based product. Norms, standards and guidelines provide the necessary orientation in the process.
The benefits of using Q-DAS qs-STAT include:
Benefits And Features
Reliable statistics
There are numerous statistical procedures available to identify the best distribution model and assign data to the respective process model. Using standardized evaluations also guarantees the reproducibility of results.
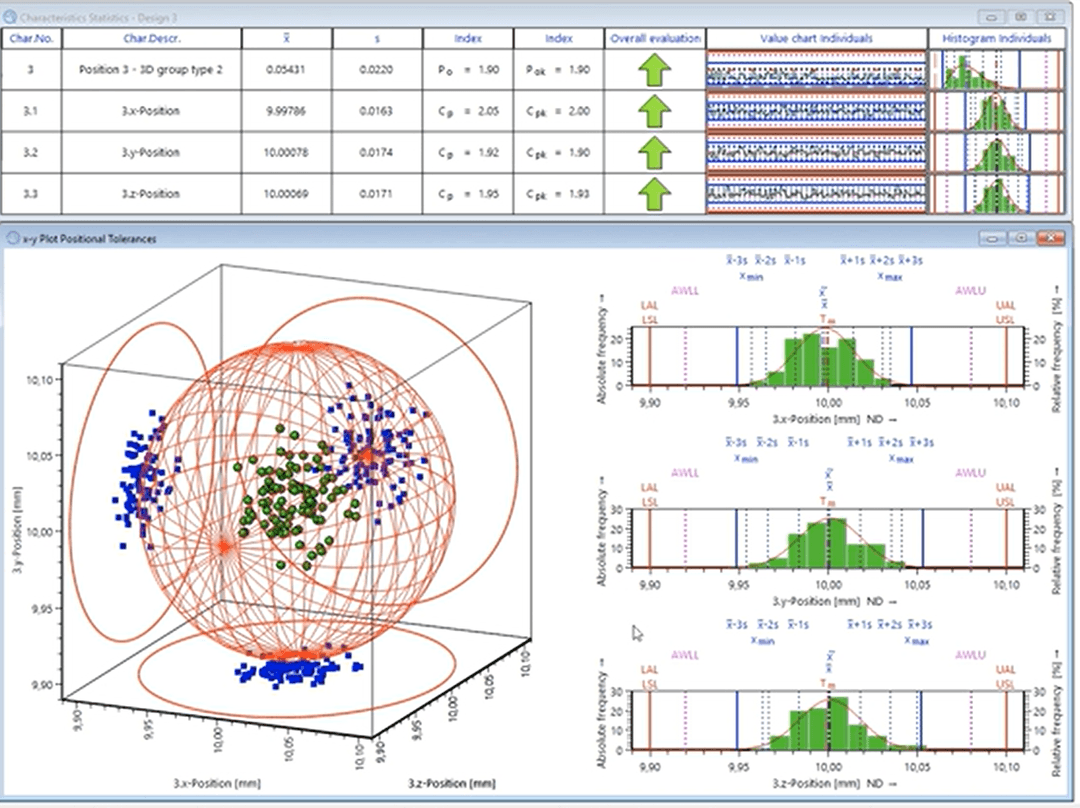
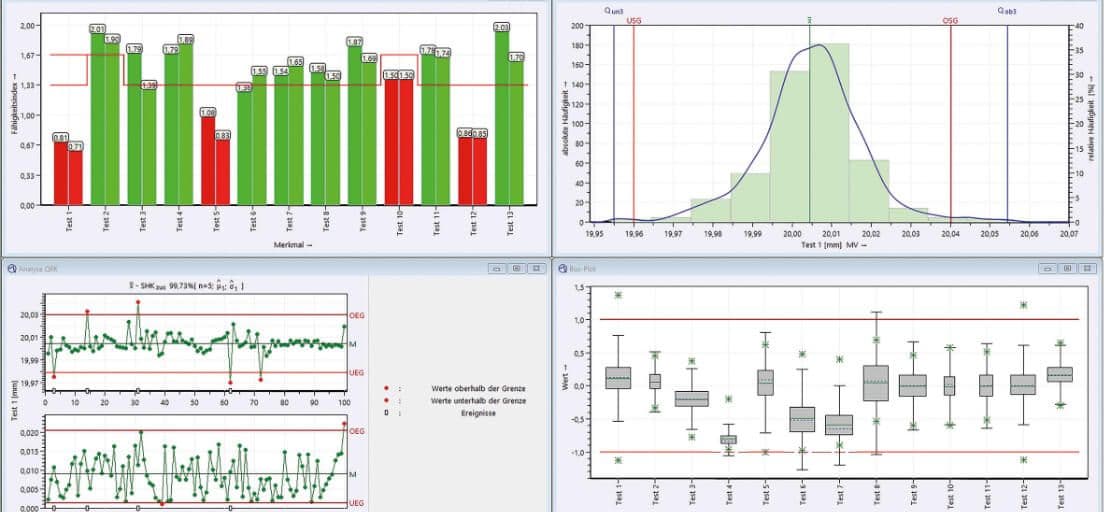
Visualization of results
Clearly understandable and significant graphics illustrate the calculated statistics and make identifying critical processes straightforward. Q-DAS qs-STAT focuses on clarity to highlight weak points and deviations, with summary graphics an essential tool for defining corrective actions to optimize the process.
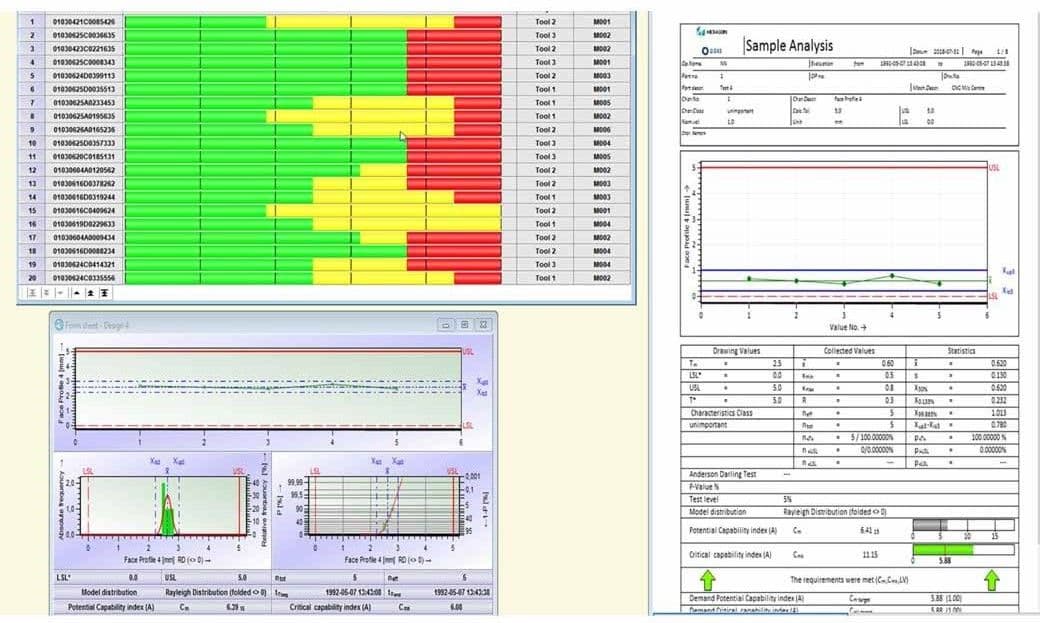
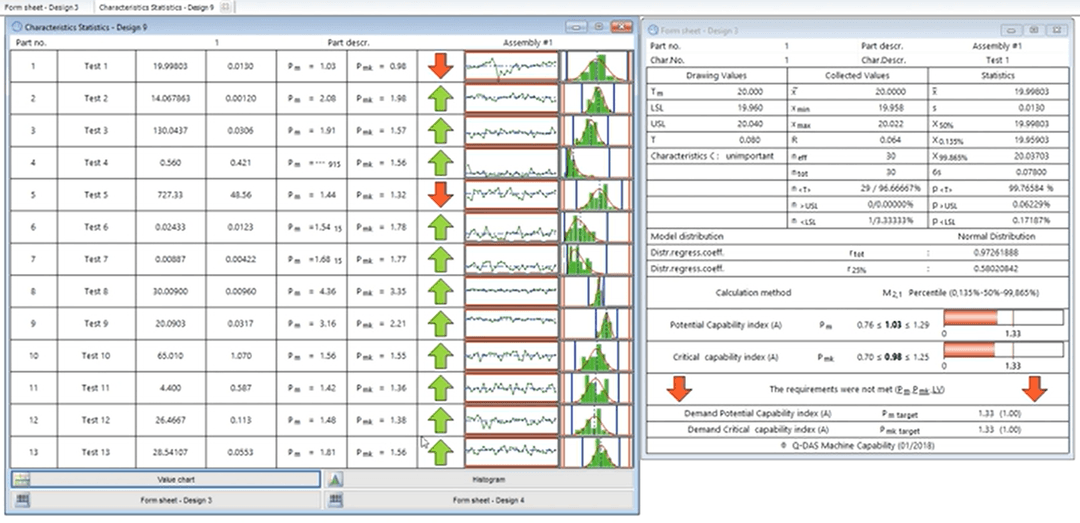
Accessible reporting
Informative graphics, key performance indicators, and reports provide an accurate, efficient, and easily interpretable analysis of process capability.
Training and Resources

Connect and collaborate with your peers and experts
The Nexus Community provides you with excellent peer forums and the opportunity to learn from thousands of others in your industry. Currently, hundreds of peer forums waiting for you to explore into. Discover best practices and get the answers you need to succeed. Register for Nexus to get full access the Community forums.

Our team is ready to help
Our technical support teams are on hand to answer your questions. Contact us through our online form and we will get right back to you.
You might be interested in...
Related products
Reliable results
Q-DAS qs-STAT is for the evaluation and continuous improvement of industrial production processes and is also available as a web-based product. Norms, standards and guidelines provide the necessary orientation in the process.
The benefits of using Q-DAS qs-STAT include:
Take advantage of various learning opportunities
Visit the Nexus Academy Catalog for a complete list of educational content. You can enroll for training, complete self-paced courses, register for distance learning, classroom instruction, live training events, and download or print your completion certificate.

Dive into our documentation to explore the full potential of our product offerings
Your ultimate resource for practical guidance and support. Here you’ll find a wealth of step-by-step how-to guides, detailed tutorials, and handy tips and tricks. Whether you’re troubleshooting an issue or looking for ways to optimize your use of our products, our Documentation Center provides clear and concise information to help you get the most out of your experience.

Expand your knowledge
Our Knowledge Base is your go-to hub for in-depth insights and valuable information. Explore a rich collection of articles and detailed white papers crafted to provide you with the knowledge you need to excel. From industry trends to expert analyses, our Knowledge Base is designed to keep you informed and empowered with the latest and most relevant content.

Downloads are only available on the desktop version. Please access our site from a desktop to download.
Get the most out of our resources.
For the latest updates, resources, and software, please visit our Download Center
Click the link to access the files you need today
Frequently Asked Questions
The Q-Das Software provides a wide range of calculation methods and different capability indices from different markets. Naming conventions from different guidelines can be taken into account. The general documentation of the evaluation-strategy with all its possibilities can be found here.